
 Image 1 of 4
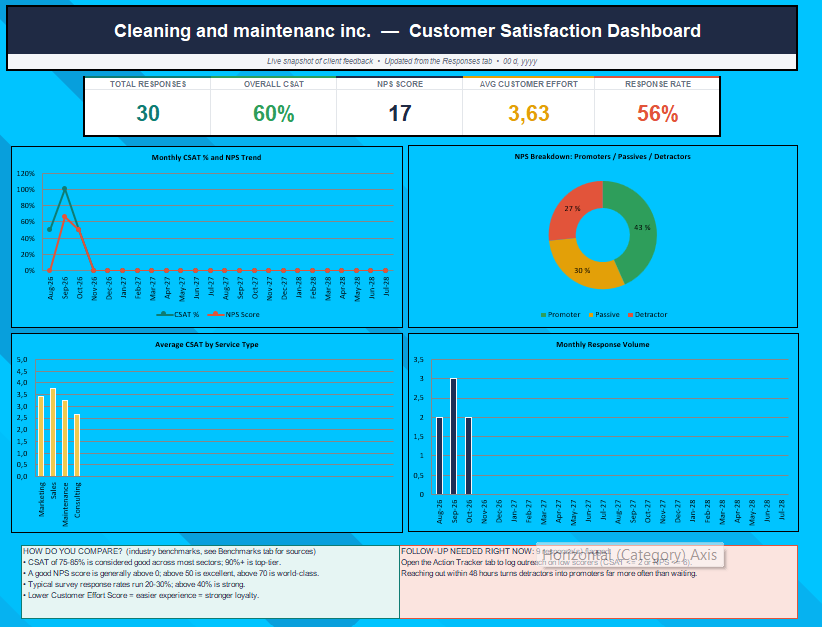 Image 2 of 4
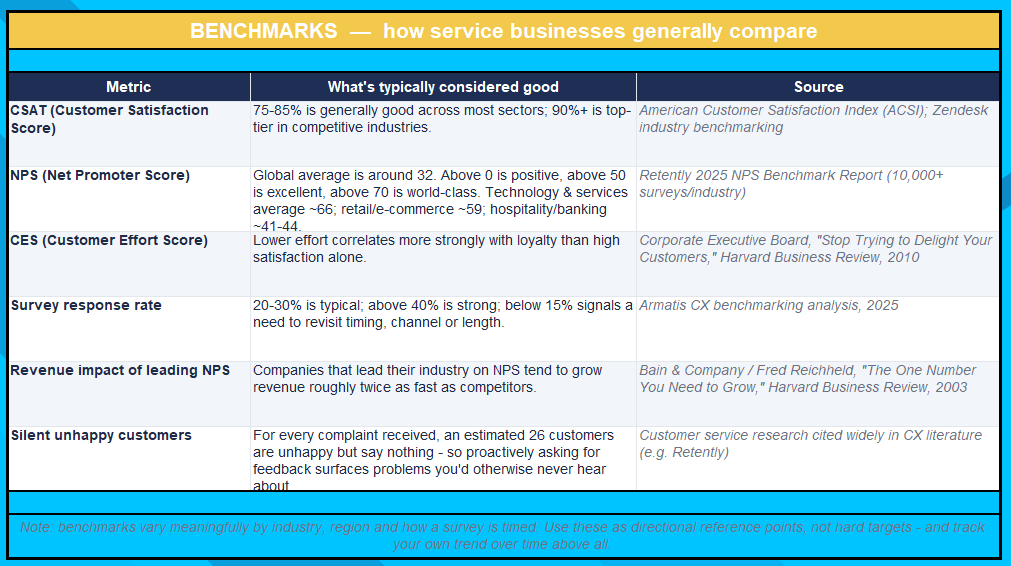 Image 3 of 4
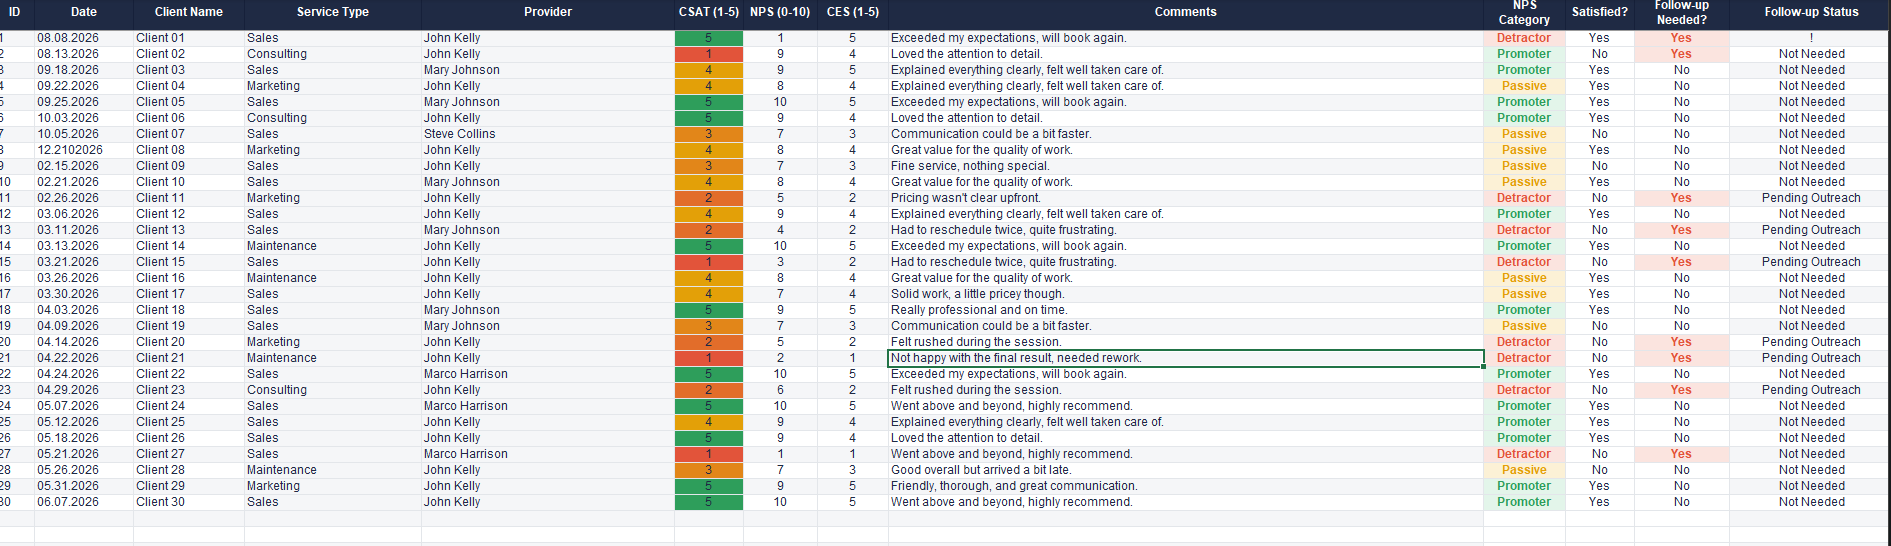 Image 4 of 4
One Excel file. Your entire client feedback process: survey → tracking → dashboard → action.
Is your client feedback right now scattered across emails, notes, or nowhere at all? This toolkit brings it all into one place — whether you're a consultant, cleaner, coach, trainer, or any other service-based professional.
What you get
One Excel file, eight ready-to-use tabs:
1. Read Me — A clear guide to every tab, so you can get started right away.
2. Settings — Enter your business name, tagline, and contact email, set how many surveys you send per period (for response-rate tracking), and edit the Service Type, Team Member, and Status lists to match your business. Supports up to 30 service types, 40 team members, and 8 statuses — every dropdown in the workbook updates automatically.
3. Feedback Survey — A clean, printable one-page survey for your clients: export as PDF, print, email, or send the file directly. Three short rating questions (satisfaction, likelihood to recommend, ease of doing business) plus three open-ended questions — deliberately brief to keep completion rates high.
4. Responses — Your feedback log. Copy answers from returned surveys here, or type them in directly — built for 1,000 responses, enough for years of use. Service Type, Team Member, and Follow-up Status are dropdowns pulled from Settings; NPS category, satisfaction flag, and follow-up flag are calculated automatically for every row.
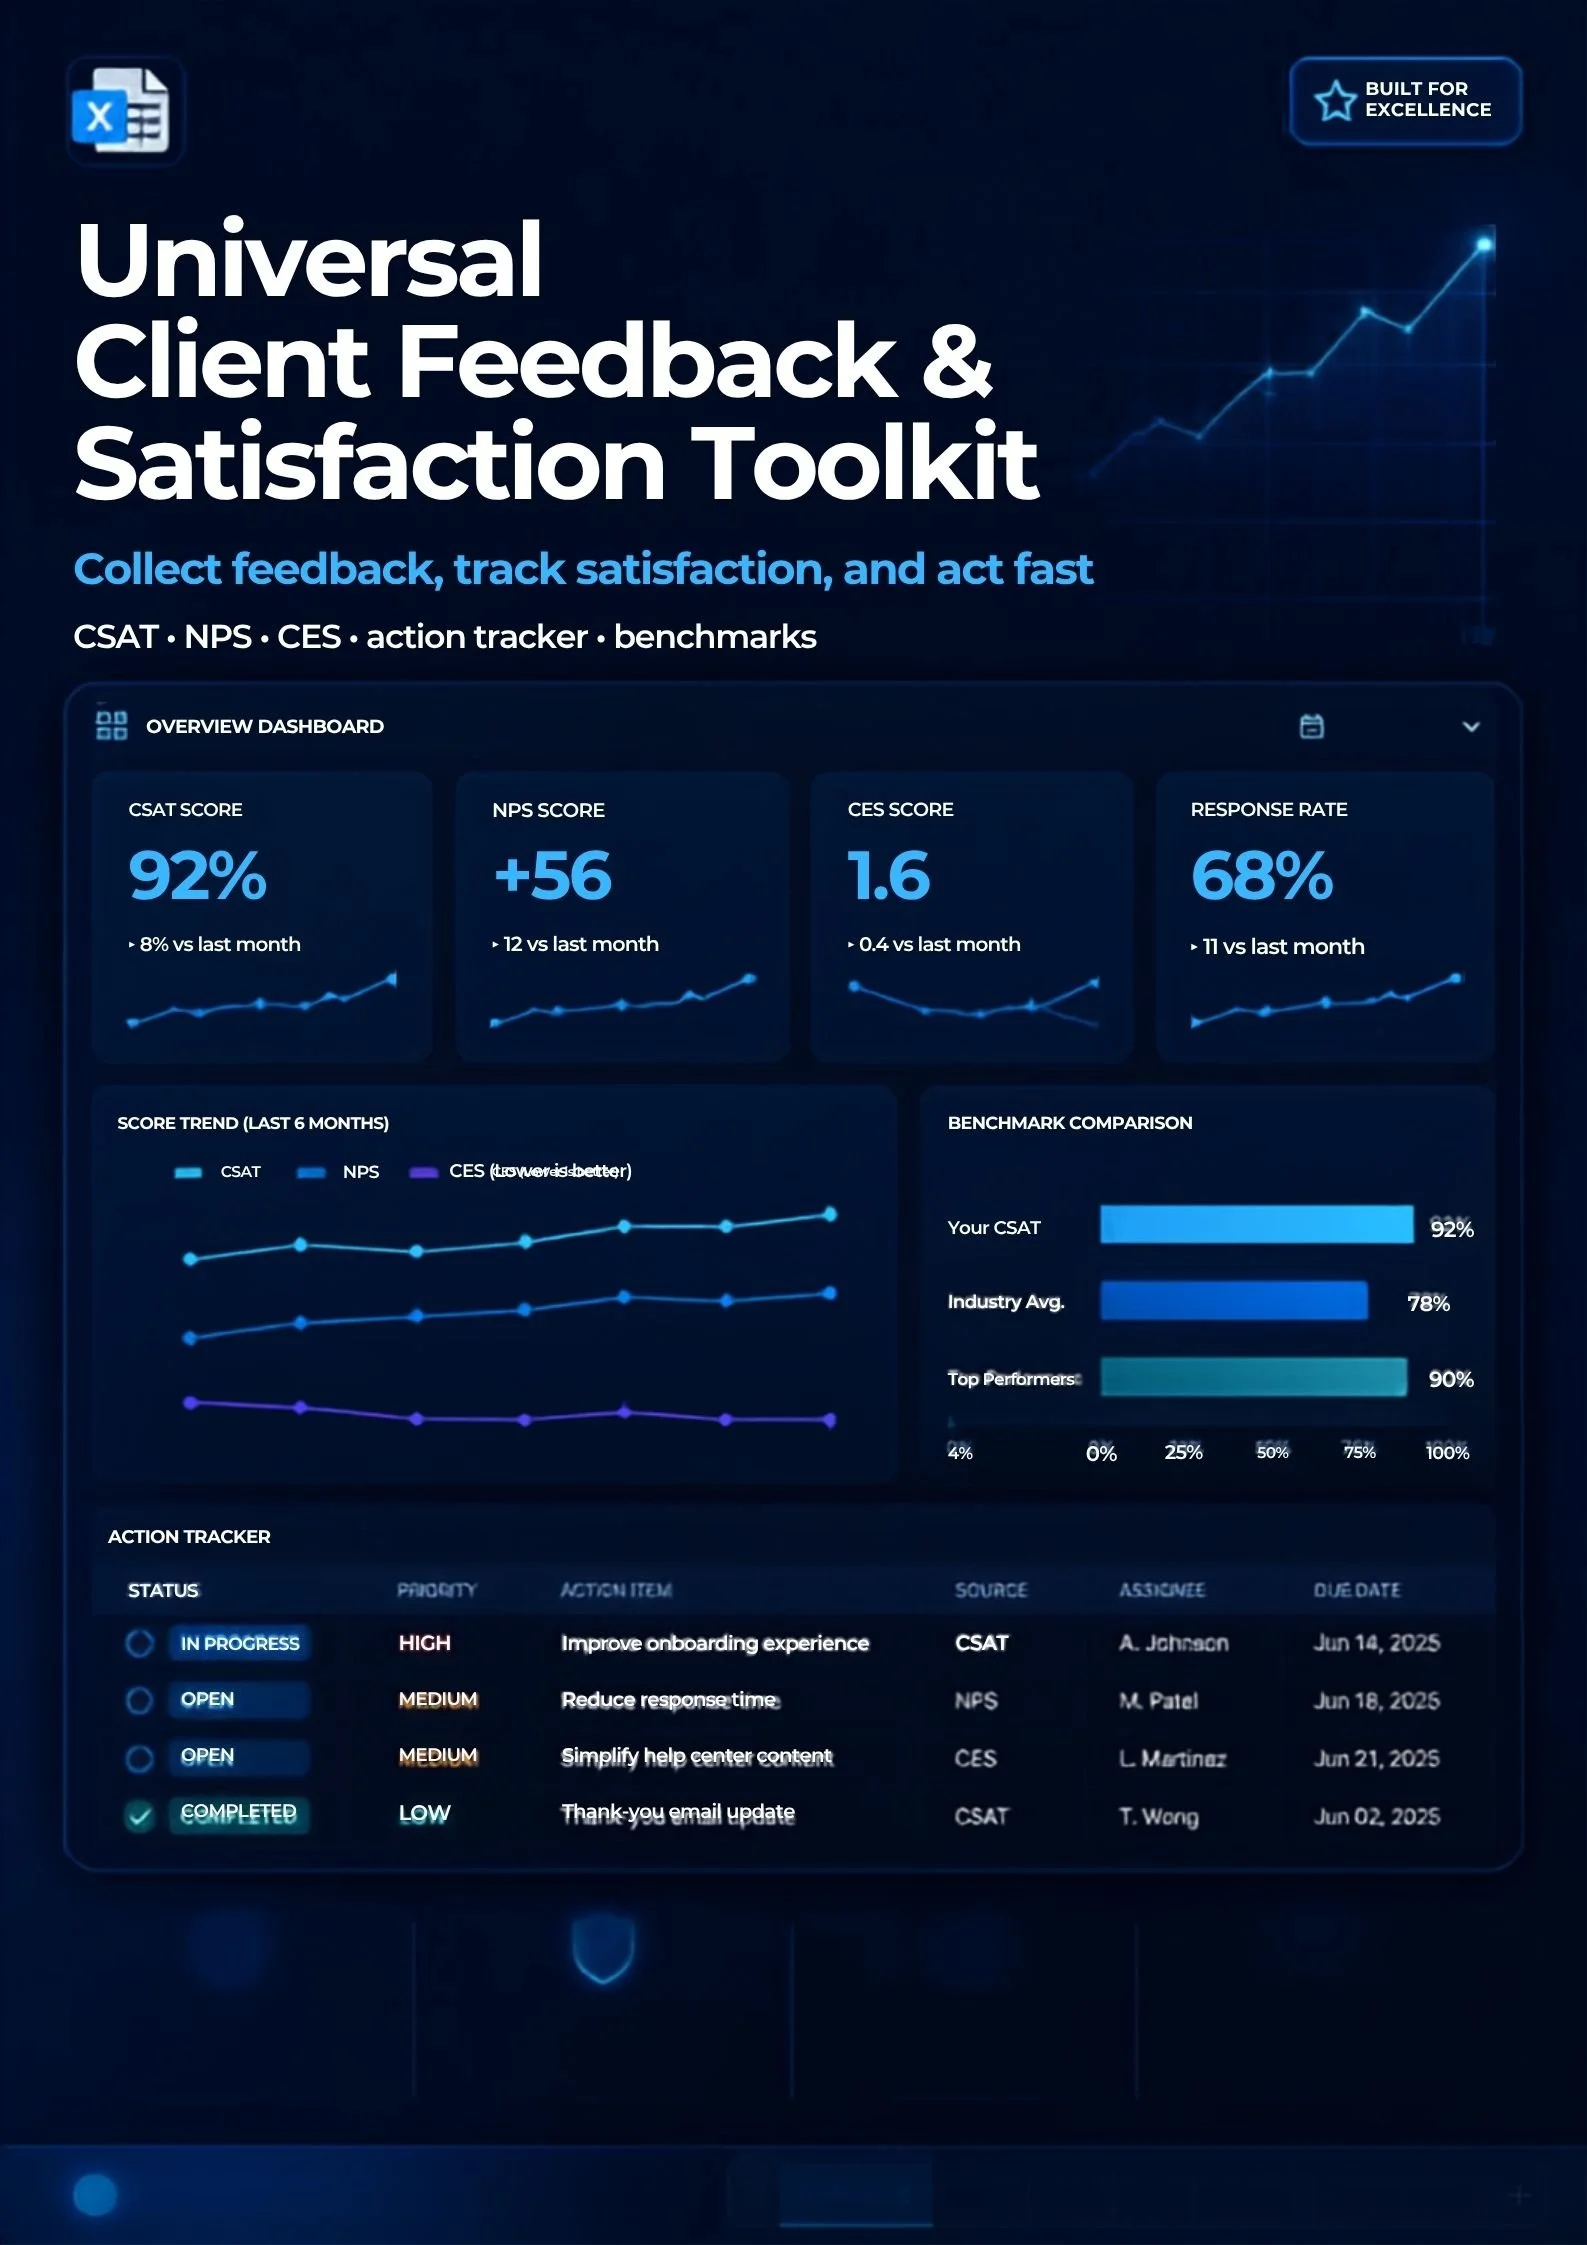
5. Dashboard — A live, auto-updating view of your CSAT %, NPS score, average customer effort, response rate, trend over time, performance by service type, NPS mix, a benchmark comparison, and an alert for outstanding follow-ups. Everything recalculates automatically as you add rows to Responses.
6. Action Tracker — Rows with a CSAT ≤ 2 or NPS ≤ 6 are pulled in automatically from Responses the moment they're entered — no copy-pasting required. Assign an owner, log the action taken, and track status through to "Resolved" using the built-in dropdown.
7. Benchmarks — Reference points from published customer-experience research, so you know instantly whether your scores are strong, average, or need attention. Sources include the American Customer Satisfaction Index, the Retently NPS Benchmark Report, and Bain & Company's NPS research.
8. ChartData — Supporting data behind the Dashboard's charts.
Why CSAT, NPS, and CES?
CSAT captures how a specific interaction or job made the client feel.
NPS captures long-term loyalty and referral likelihood — the strongest driver of organic growth.
CES captures friction: how easy or hard it was to work with you — research links this closely to repeat business.
Together, these three metrics give you a quantitative trend plus qualitative context.
Why bother asking for feedback systematically?
Research suggests that for every complaint a business receives, roughly 26 customers are unhappy but say nothing — systematically asking for feedback surfaces problems you'd otherwise never hear about. And companies that lead their industry on NPS tend to grow revenue roughly twice as fast as their competitors.
Works right out of the box
Every formula, automation, and chart is already built — just open the file, enter your details on the Settings tab, and start collecting feedback immediately. No plug-ins, no monthly fees, no separate software.
One Excel file. Your entire client feedback process: survey → tracking → dashboard → action.
Is your client feedback right now scattered across emails, notes, or nowhere at all? This toolkit brings it all into one place — whether you're a consultant, cleaner, coach, trainer, or any other service-based professional.
What you get
One Excel file, eight ready-to-use tabs:
1. Read Me — A clear guide to every tab, so you can get started right away.
2. Settings — Enter your business name, tagline, and contact email, set how many surveys you send per period (for response-rate tracking), and edit the Service Type, Team Member, and Status lists to match your business. Supports up to 30 service types, 40 team members, and 8 statuses — every dropdown in the workbook updates automatically.
3. Feedback Survey — A clean, printable one-page survey for your clients: export as PDF, print, email, or send the file directly. Three short rating questions (satisfaction, likelihood to recommend, ease of doing business) plus three open-ended questions — deliberately brief to keep completion rates high.
4. Responses — Your feedback log. Copy answers from returned surveys here, or type them in directly — built for 1,000 responses, enough for years of use. Service Type, Team Member, and Follow-up Status are dropdowns pulled from Settings; NPS category, satisfaction flag, and follow-up flag are calculated automatically for every row.
5. Dashboard — A live, auto-updating view of your CSAT %, NPS score, average customer effort, response rate, trend over time, performance by service type, NPS mix, a benchmark comparison, and an alert for outstanding follow-ups. Everything recalculates automatically as you add rows to Responses.
6. Action Tracker — Rows with a CSAT ≤ 2 or NPS ≤ 6 are pulled in automatically from Responses the moment they're entered — no copy-pasting required. Assign an owner, log the action taken, and track status through to "Resolved" using the built-in dropdown.
7. Benchmarks — Reference points from published customer-experience research, so you know instantly whether your scores are strong, average, or need attention. Sources include the American Customer Satisfaction Index, the Retently NPS Benchmark Report, and Bain & Company's NPS research.
8. ChartData — Supporting data behind the Dashboard's charts.
Why CSAT, NPS, and CES?
CSAT captures how a specific interaction or job made the client feel.
NPS captures long-term loyalty and referral likelihood — the strongest driver of organic growth.
CES captures friction: how easy or hard it was to work with you — research links this closely to repeat business.
Together, these three metrics give you a quantitative trend plus qualitative context.
Why bother asking for feedback systematically?
Research suggests that for every complaint a business receives, roughly 26 customers are unhappy but say nothing — systematically asking for feedback surfaces problems you'd otherwise never hear about. And companies that lead their industry on NPS tend to grow revenue roughly twice as fast as their competitors.
Works right out of the box
Every formula, automation, and chart is already built — just open the file, enter your details on the Settings tab, and start collecting feedback immediately. No plug-ins, no monthly fees, no separate software.