
Business Tools
Smart, ready‑to‑use tools for managing your business.
A collection of practical calculators, trackers and dashboards that help you stay on top of finances, sales, projects and daily operations. Built for small businesses, our tools are simple to use, cost‑effective and instantly helpful — no complex software or subscriptions required.
Includes:
Financial calculators & cost tracking
Sales and marketing trackers
Project & time management tools
Cashflow, budgeting and KPI dashboards
Custom‑built calculators and mini‑apps
Lever Torque – Breakpoint
Break-Even & Profitability Calculator
Know exactly when you start making money — before you spend another euro.
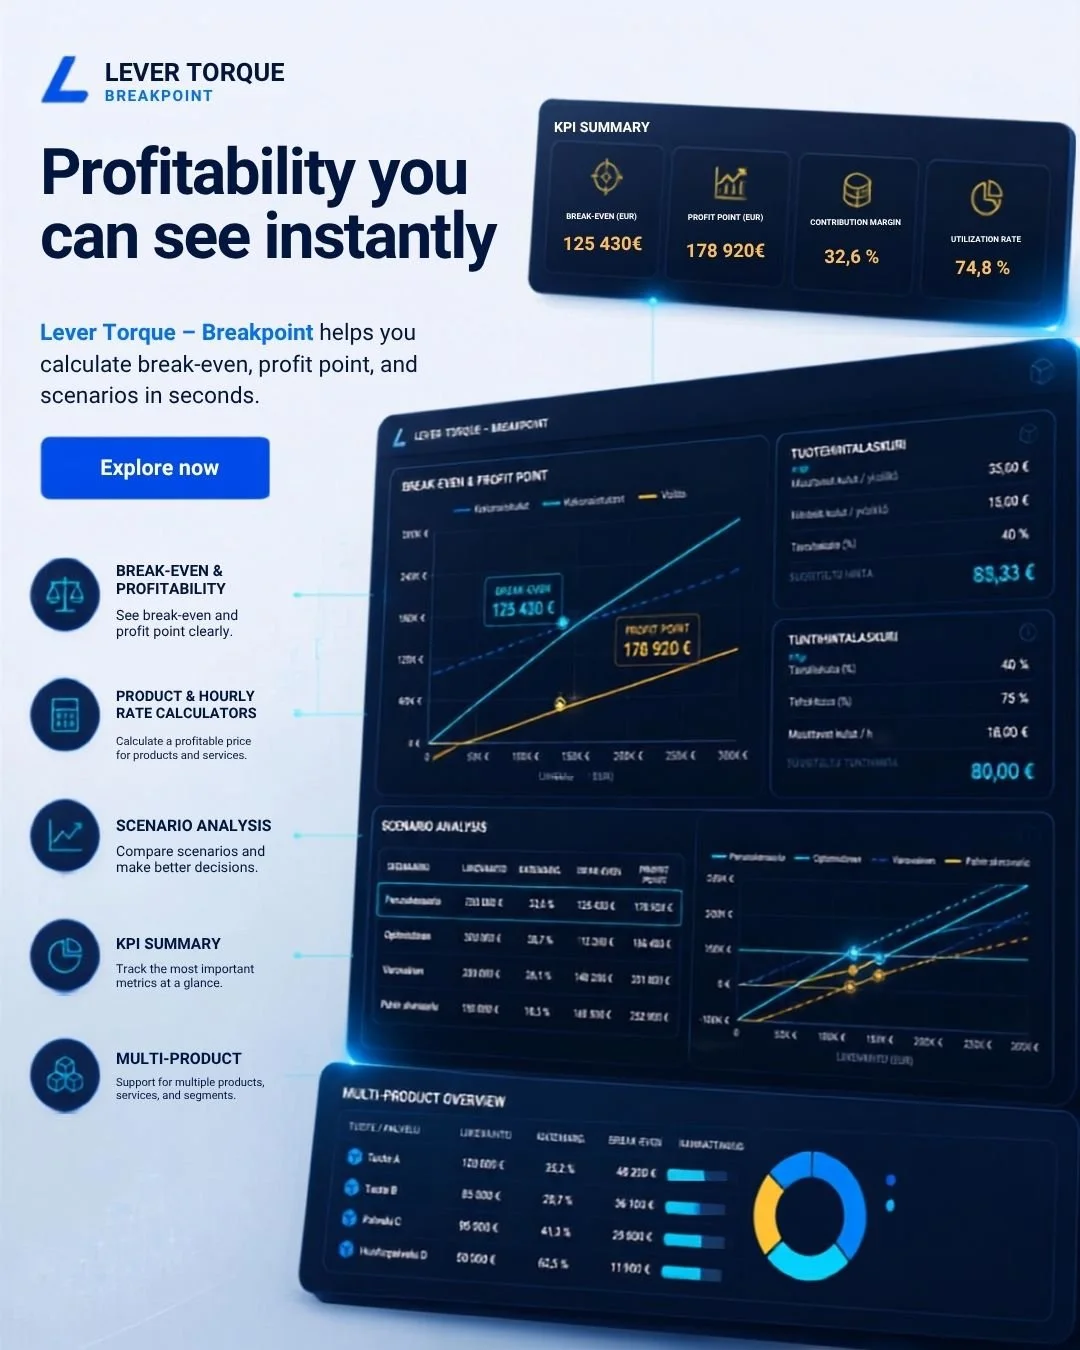
Stop guessing whether your pricing actually works. Breakpoint is a fully automated Excel dashboard that shows you your break-even point, profit targets, and safety margin in real time — for both product sales and hourly-rate services, in one file.
What's inside:
Product & Hourly Calculators (side by side) — Enter your selling price, variable cost, fixed costs, and sales volume to get instant contribution margin, break-even units/revenue, and profit-point targets. Works whether you sell products or charge by the hour.
Scenario Analysis — A full price × volume sensitivity grid, plus a Pessimistic / Base Case / Optimistic comparison, so you can pressure-test a price change before you make it.
Live Charts & Visuals — Cost-Volume-Profit, profit-at-volume, and safety-margin charts, all updating automatically as you change your numbers.
Multi-Product Break-Even — Enter up to 5 products; shared fixed costs are automatically allocated by revenue share, giving you an individual break-even per product plus one combined Portfolio Break-Even.
Protected & Error-Proof — All formulas and chart data are locked, so you can't accidentally break the calculations.
Step-by-step instructions included
Requirements: Microsoft Excel (desktop or Microsoft 365). No macros, no add-ins, no experience required.
Lever Torque – Breakpoint is part of the Lever series by JSL Lever.

Lever Torque – Breakpoint
Break-Even & Profitability Calculator
Know exactly when you start making money — before you spend another dollar.
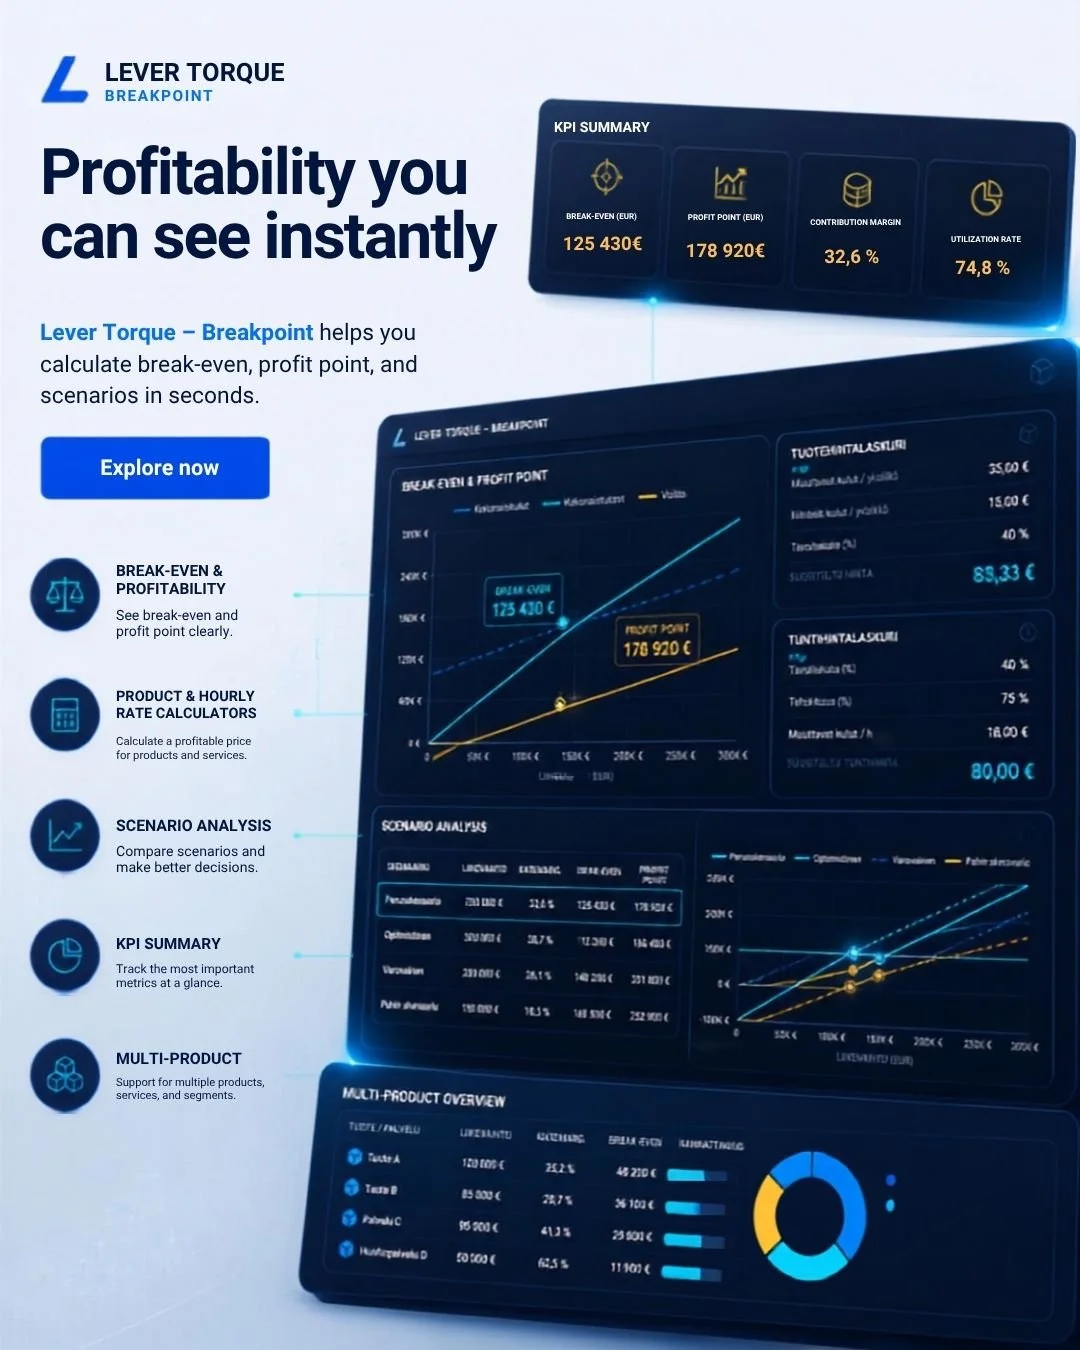
Stop guessing whether your pricing actually works. Breakpoint is a fully automated Excel dashboard that shows you your break-even point, profit targets, and safety margin in real time — for both product sales and hourly-rate services, in one file.
What's inside:
Product & Hourly Calculators (side by side) — Enter your selling price, variable cost, fixed costs, and sales volume to get instant contribution margin, break-even units/revenue, and profit-point targets. Works whether you sell products or charge by the hour.
Scenario Analysis — A full price × volume sensitivity grid, plus a Pessimistic / Base Case / Optimistic comparison, so you can pressure-test a price change before you make it.
Live Charts & Visuals — Cost-Volume-Profit, profit-at-volume, and safety-margin charts, all updating automatically as you change your numbers.
Multi-Product Break-Even — Enter up to 5 products; shared fixed costs are automatically allocated by revenue share, giving you an individual break-even per product plus one combined Portfolio Break-Even.
Protected & Error-Proof — All formulas and chart data are locked, so you can't accidentally break the calculations.
Step-by-step instructions included
Requirements: Microsoft Excel (desktop or Microsoft 365). No macros, no add-ins, no experience required.
Lever Torque – Breakpoint is part of the Lever series by JSL Lever.
Stop guessing. Start pricing like a professional.
How many brand deals have you lost because you didn't know what to ask for? Or worse — how many did you underprice because you had no way to justify a higher number?
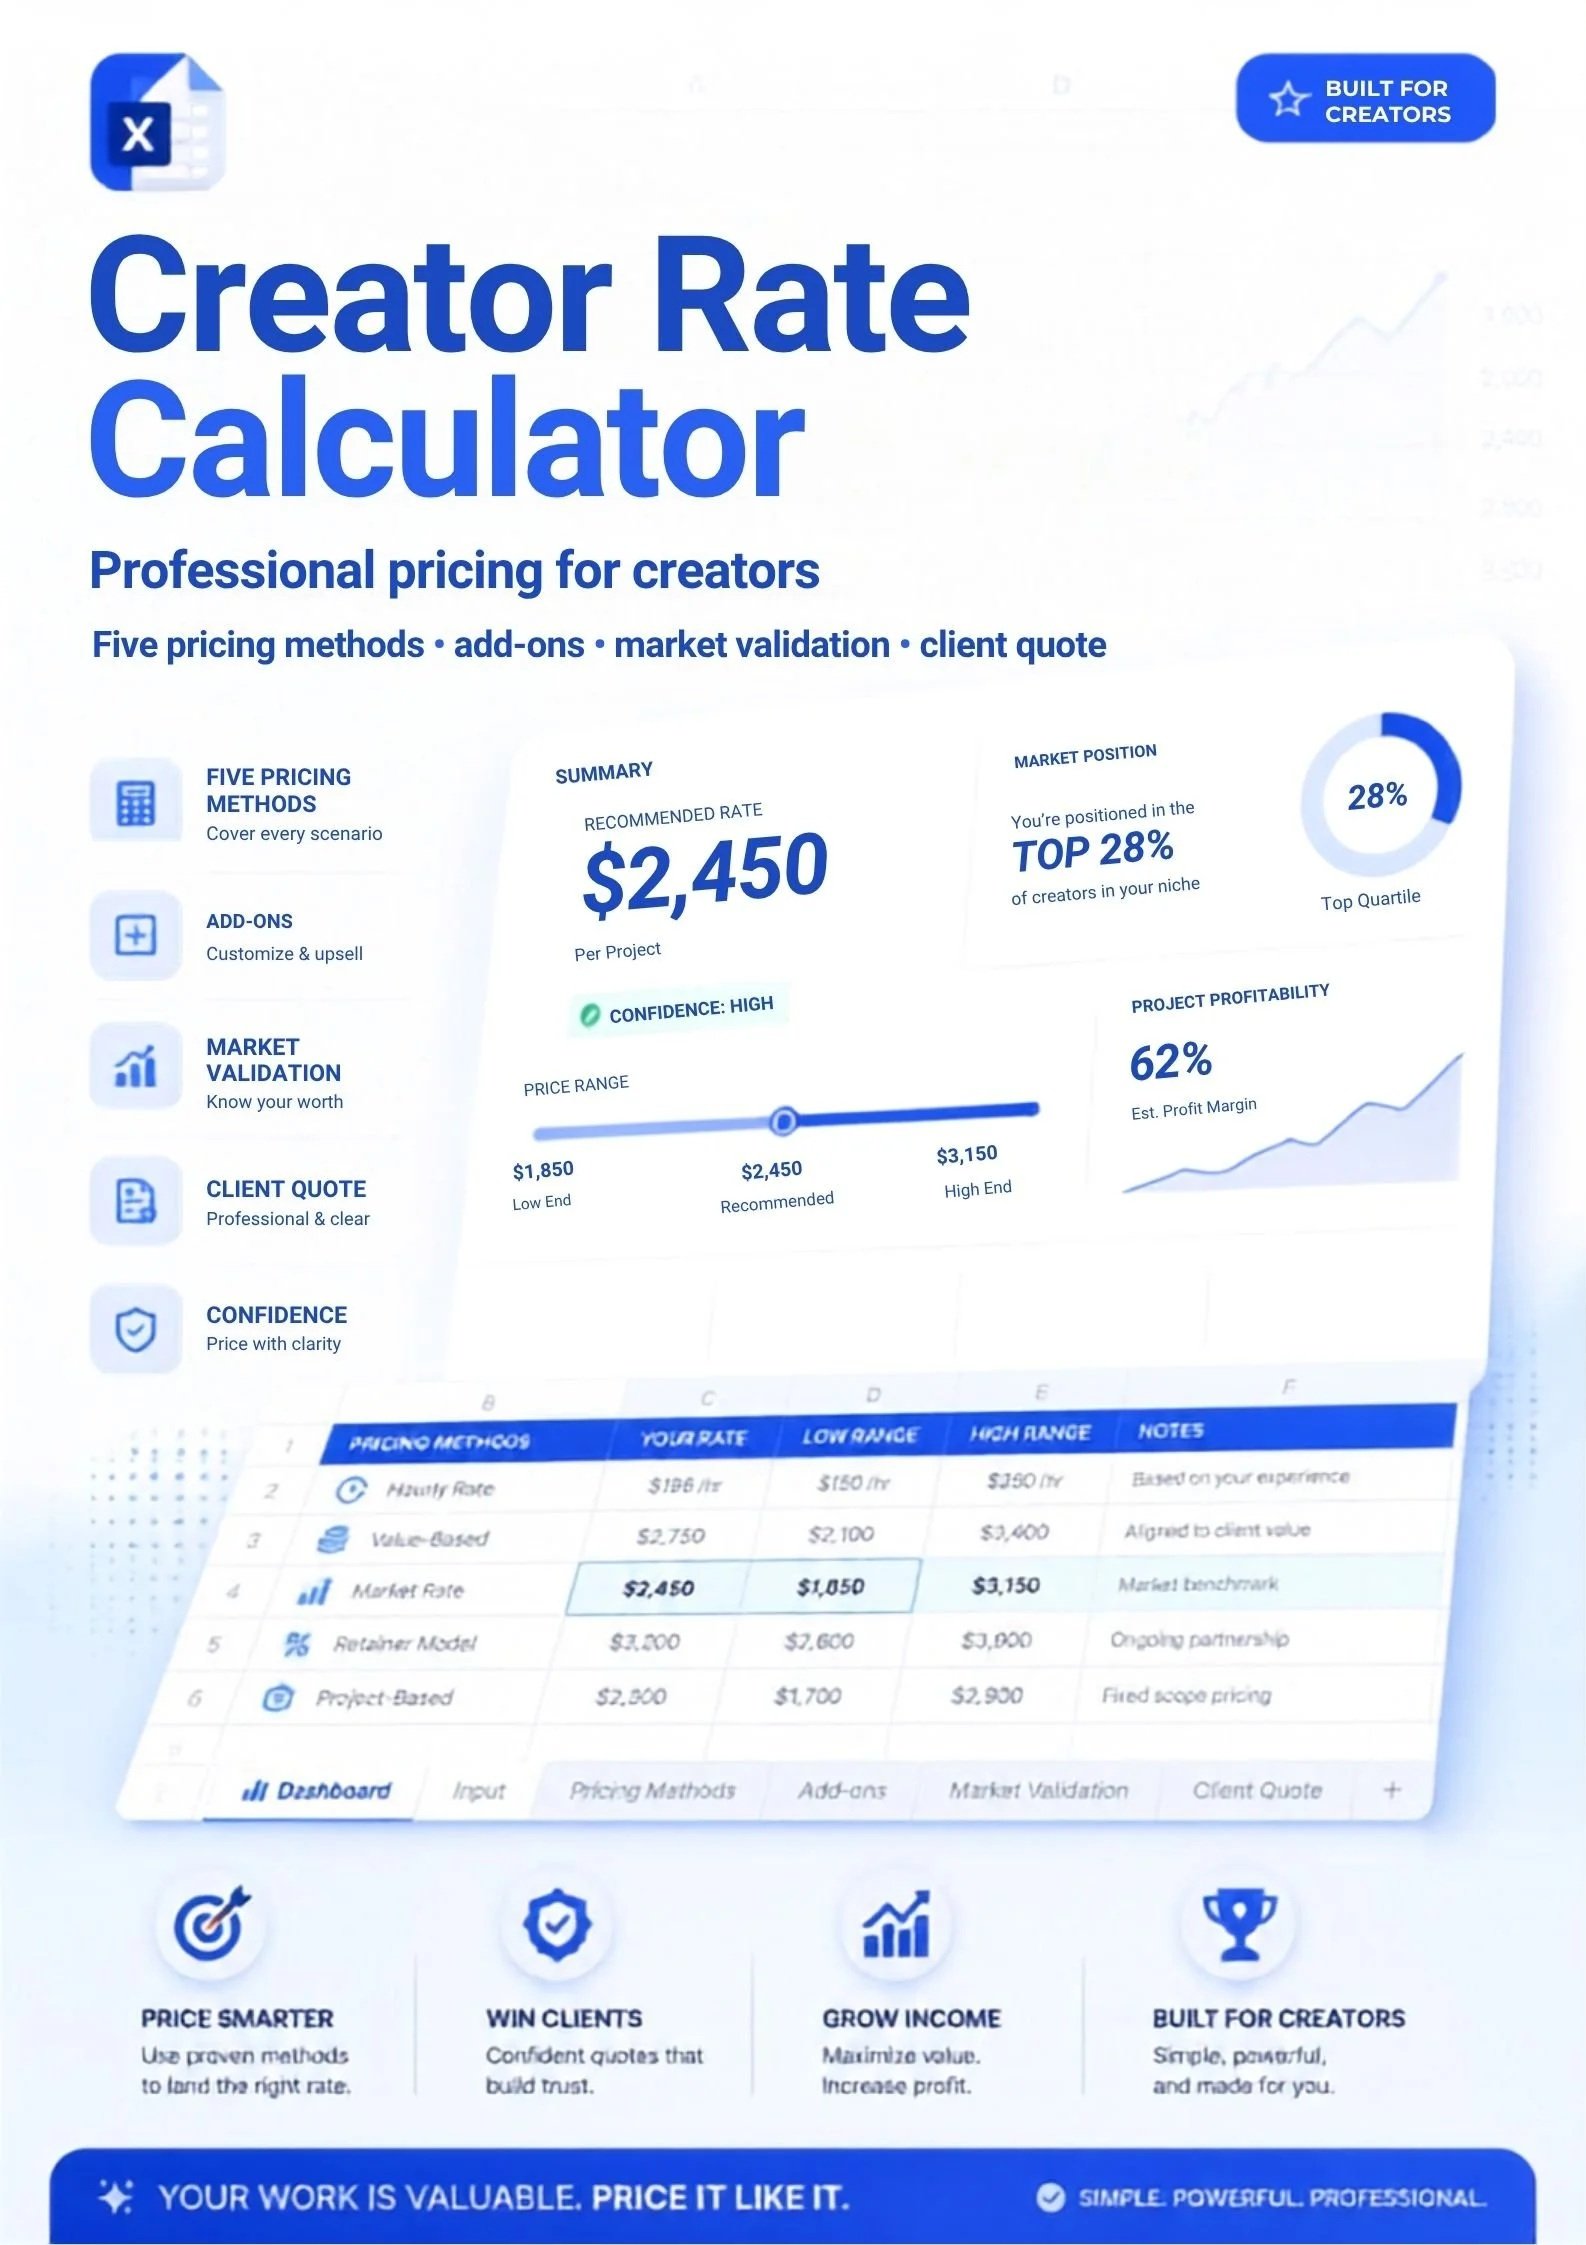
LeverTorqueInfluenceLedger is an Excel tool that calculates a defensible, market-based rate for every collaboration — in minutes, by blending five different pricing methods.
Why this tool is different
Most creators price by gut feeling or by copying someone else's rate card. This tool calculates your rate five different ways at once, then blends the results:
CPM Reach Value — what your reach would cost as a media buy
CPE Engagement Value — the value of your actual engagements, weighted by your engagement quality
Production Cost + 50% Margin — your time and hard costs, priced with a healthy margin and adjusted for format complexity
Per-Follower Industry Benchmark — how creators your size are typically priced
Time & Value Hybrid — your production cost with every add-on and your engagement bonus stacked on top
From these five numbers, the tool takes the median — not an average that can be skewed by outliers — as your Blended Base Price. You choose which methods to include (at least 3, ideally an odd number), so you can drop any method that doesn't fit a particular job.
Everything in one file
Calculator — enter your profile, production costs, and add-ons (usage rights, rush delivery, whitelisting, exclusivity, seasonal surge, raw footage, cross-platform reposts, and more). Everything else calculates automatically.
Dashboard — your entire pricing picture at a glance: base price, price with add-ons, total campaign price, all five methods side by side, market position, and engagement quality.
Ready-made client quote — a professional, send-ready proposal template. Fill in your handle, dates, and client details — every price row pulls directly from the calculator.
Market data — built-in 2025/2026 platform CPM/CPE rates, format multipliers, niche premiums, and market price ranges by follower tier, so you can check your number against real benchmarks.
Built-in guardrails
An automatic warning if your five pricing methods diverge by more than 3x, so you catch inconsistent inputs before quoting a client
A break-even production-cost floor, so you never price below what the job actually costs you
Auto-generated Bronze/Silver/Gold package tiers with volume discounts, ready to offer for multi-post deals
A market-position check showing exactly where your price falls within real-world ranges for your platform and follower tier
Who it's for
Content creators and influencers on Instagram, TikTok, YouTube, LinkedIn, Pinterest, X, Facebook, and podcasts — from nano and micro creators up through mega-tier accounts.
No more guessing. No more underpricing.
One Excel file. Five pricing methods. One clear, defensible number you can stand behind.
Stop guessing. Start pricing like a professional.
How many brand deals have you lost because you didn't know what to ask for? Or worse — how many did you underprice because you had no way to justify a higher number?
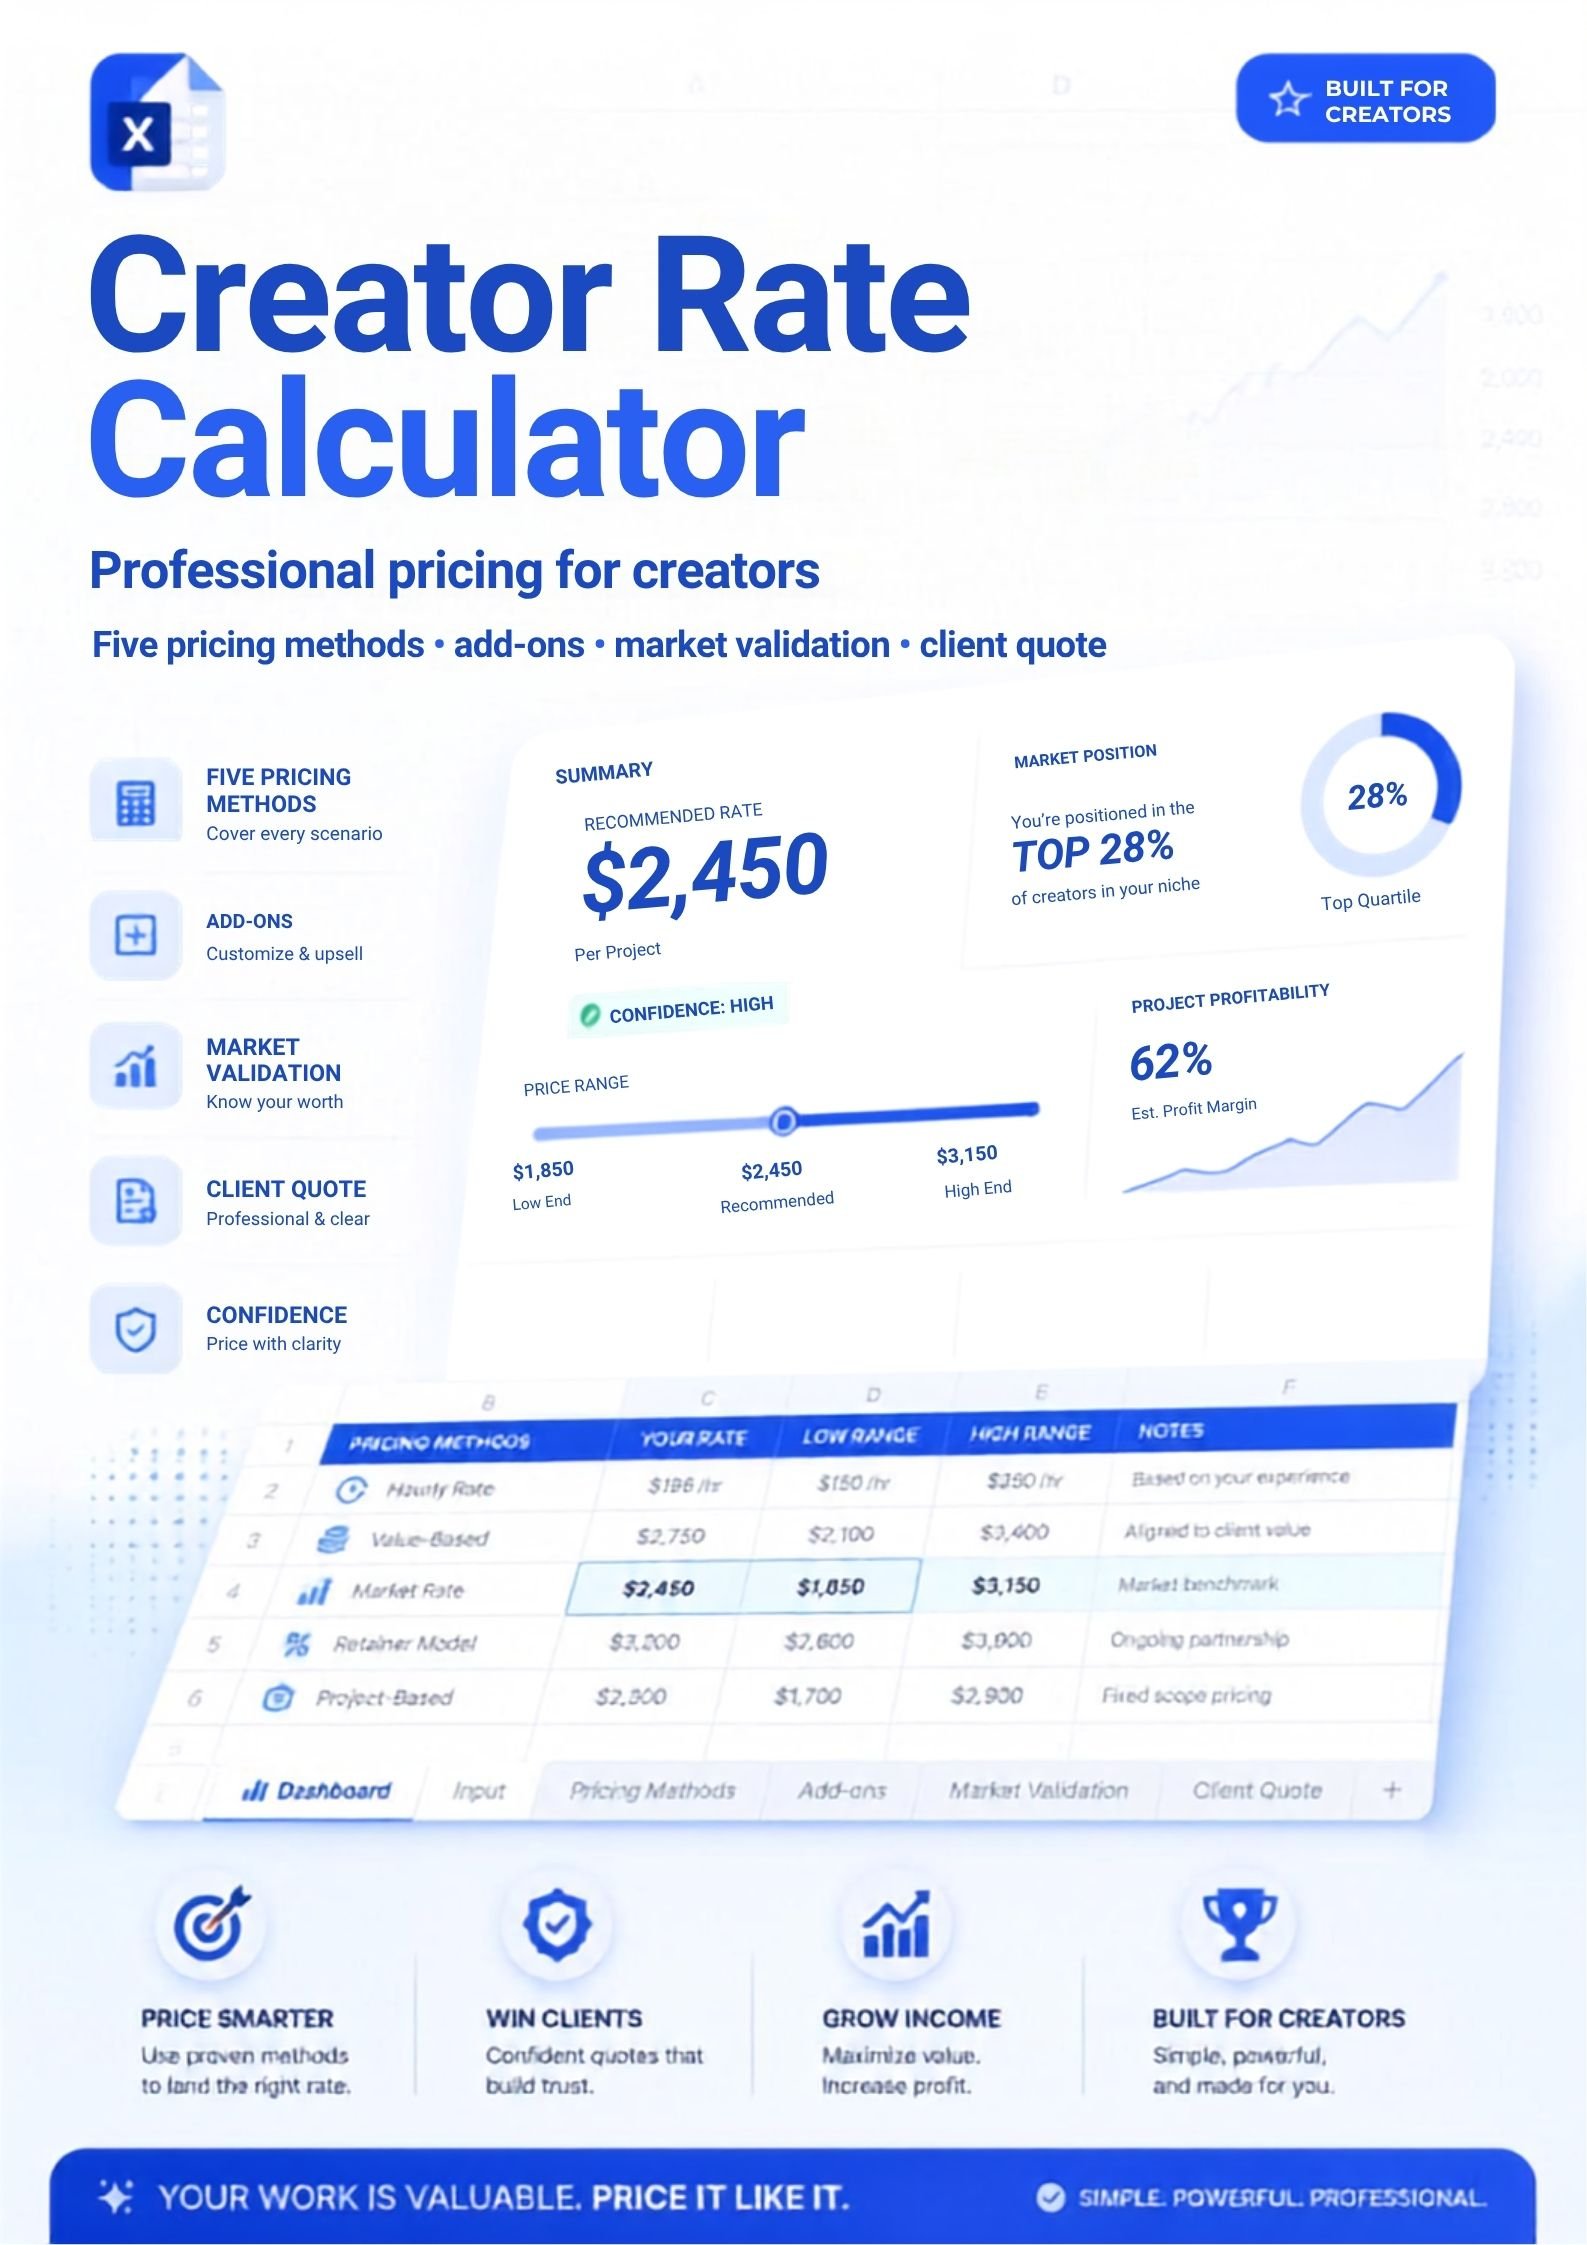
LeverTorqueInfluenceLedger is an Excel tool that calculates a defensible, market-based rate for every collaboration — in minutes, by blending five different pricing methods.
Why this tool is different
Most creators price by gut feeling or by copying someone else's rate card. This tool calculates your rate five different ways at once, then blends the results:
CPM Reach Value — what your reach would cost as a media buy
CPE Engagement Value — the value of your actual engagements, weighted by your engagement quality
Production Cost + 50% Margin — your time and hard costs, priced with a healthy margin and adjusted for format complexity
Per-Follower Industry Benchmark — how creators your size are typically priced
Time & Value Hybrid — your production cost with every add-on and your engagement bonus stacked on top
From these five numbers, the tool takes the median — not an average that can be skewed by outliers — as your Blended Base Price. You choose which methods to include (at least 3, ideally an odd number), so you can drop any method that doesn't fit a particular job.
Everything in one file
Calculator — enter your profile, production costs, and add-ons (usage rights, rush delivery, whitelisting, exclusivity, seasonal surge, raw footage, cross-platform reposts, and more). Everything else calculates automatically.
Dashboard — your entire pricing picture at a glance: base price, price with add-ons, total campaign price, all five methods side by side, market position, and engagement quality.
Ready-made client quote — a professional, send-ready proposal template. Fill in your handle, dates, and client details — every price row pulls directly from the calculator.
Market data — built-in 2025/2026 platform CPM/CPE rates, format multipliers, niche premiums, and market price ranges by follower tier, so you can check your number against real benchmarks.
Built-in guardrails
An automatic warning if your five pricing methods diverge by more than 3x, so you catch inconsistent inputs before quoting a client
A break-even production-cost floor, so you never price below what the job actually costs you
Auto-generated Bronze/Silver/Gold package tiers with volume discounts, ready to offer for multi-post deals
A market-position check showing exactly where your price falls within real-world ranges for your platform and follower tier
Who it's for
Content creators and influencers on Instagram, TikTok, YouTube, LinkedIn, Pinterest, X, Facebook, and podcasts — from nano and micro creators up through mega-tier accounts.
No more guessing. No more underpricing.
One Excel file. Five pricing methods. One clear, defensible number you can stand behind.
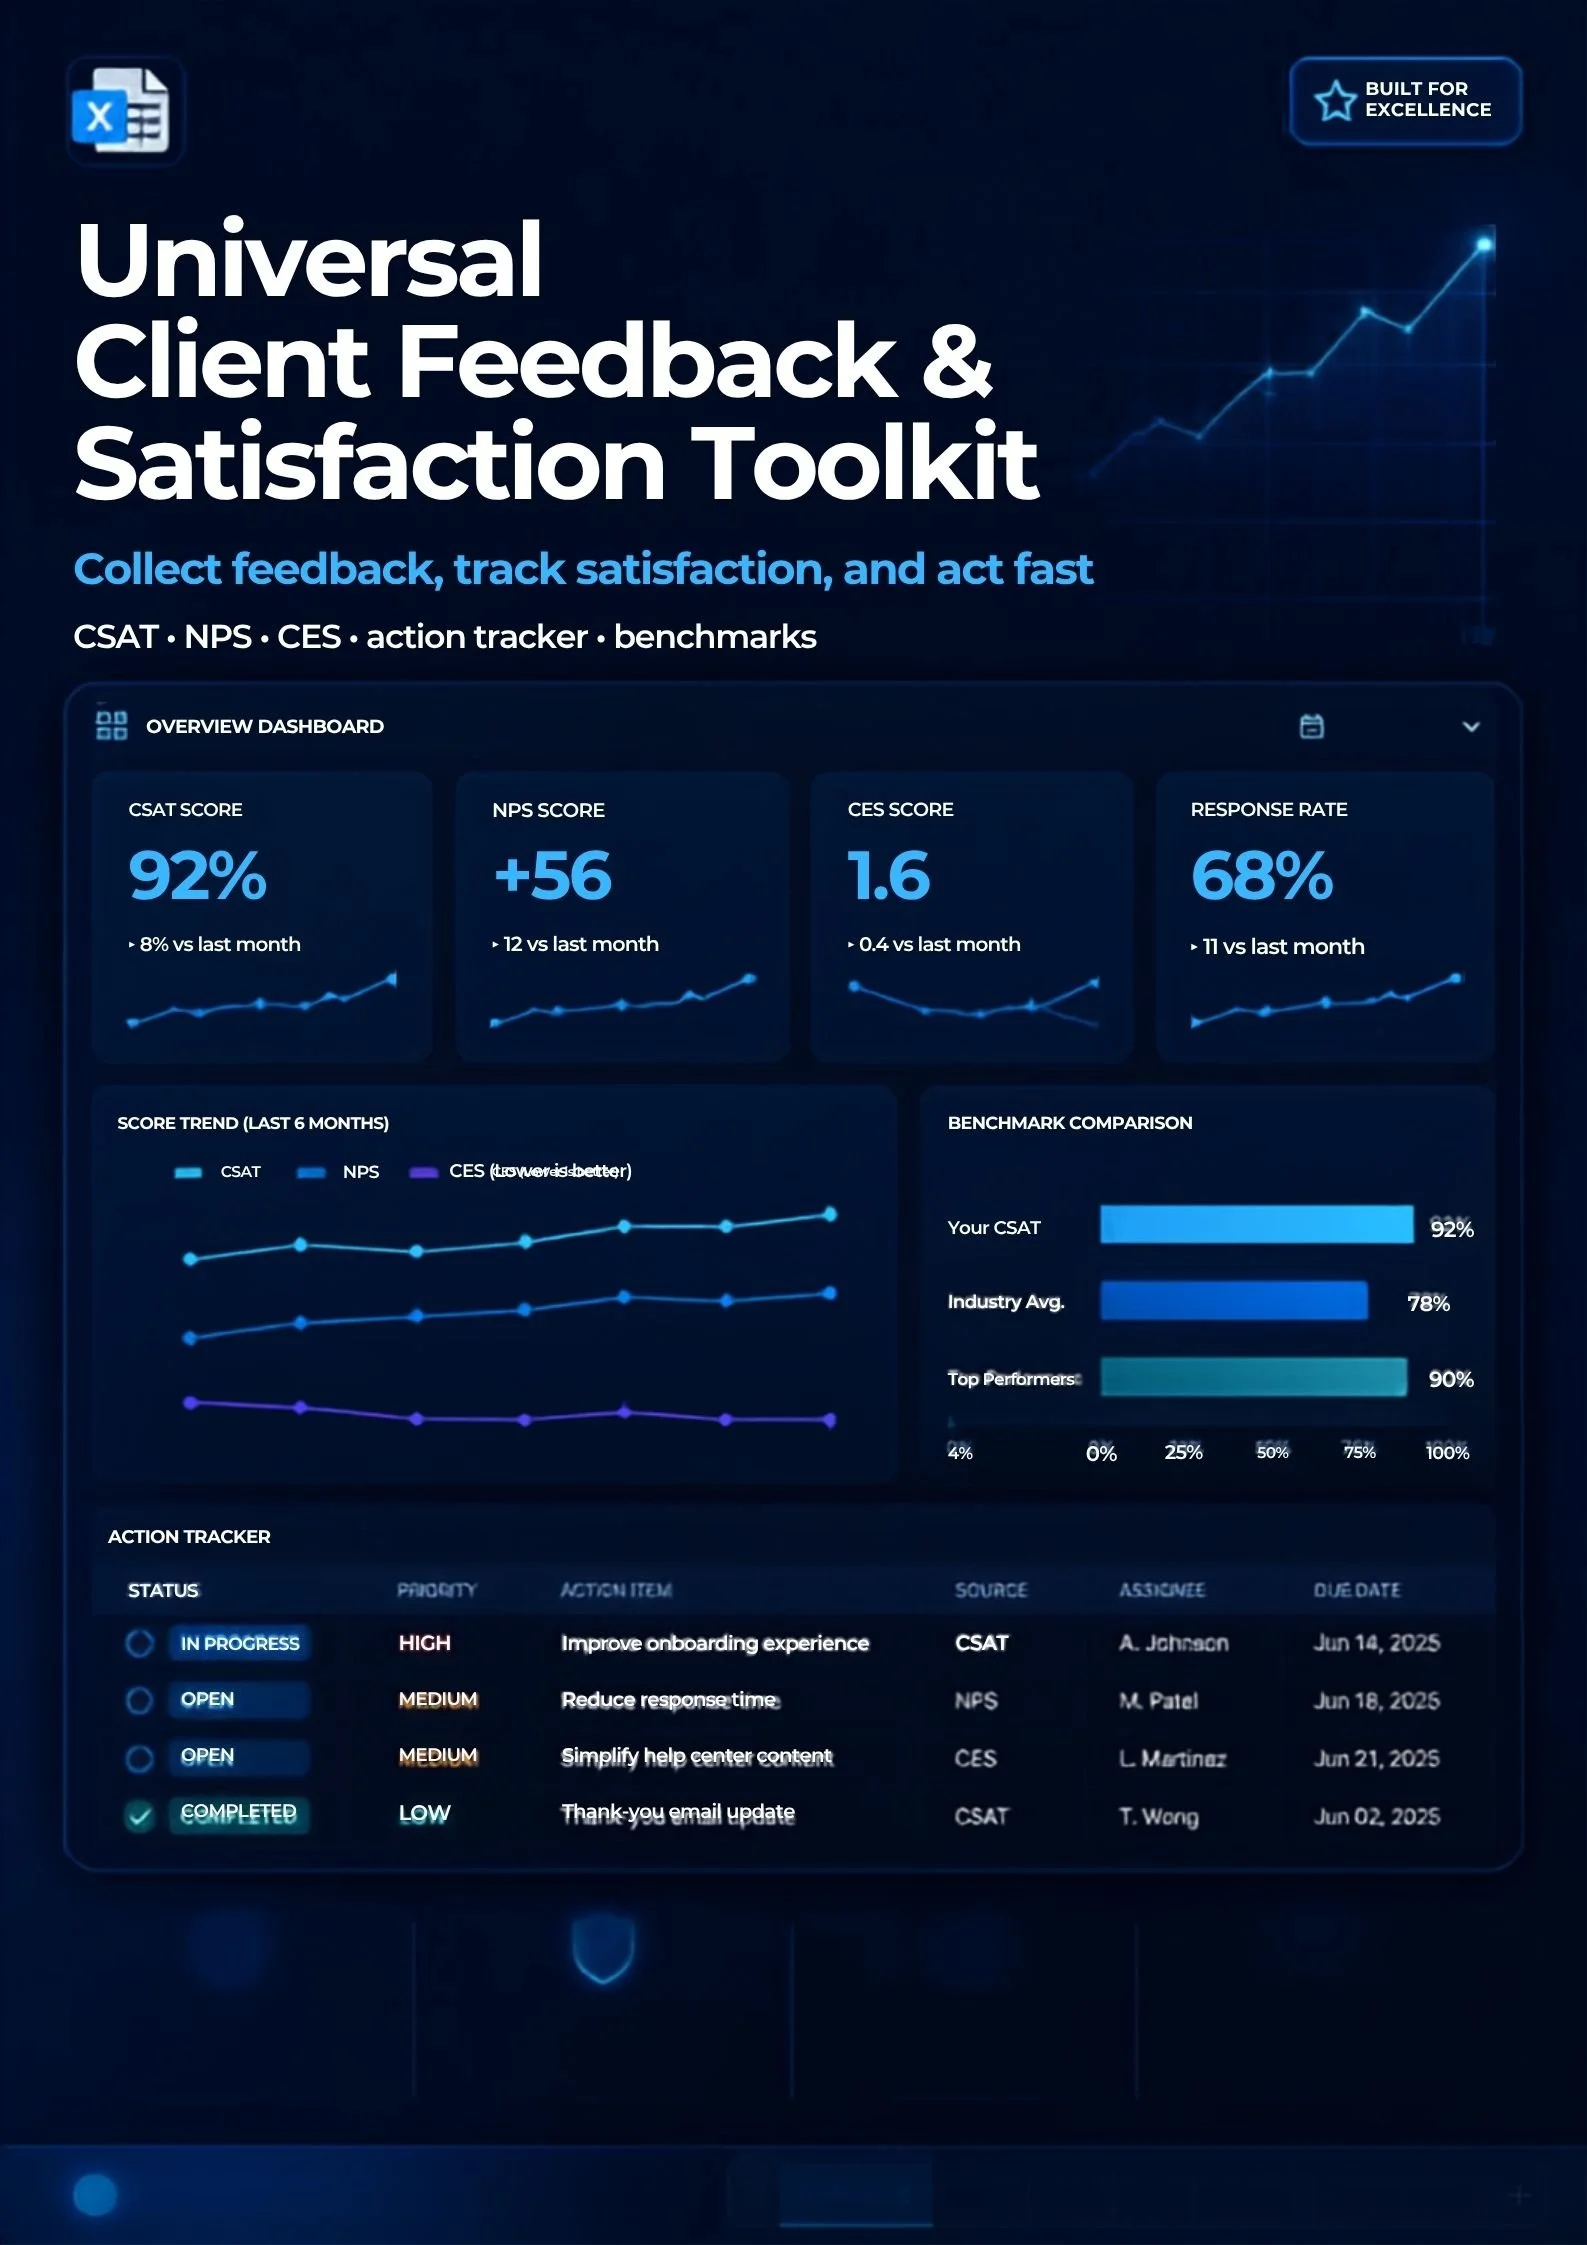
One Excel file. Your entire client feedback process: survey → tracking → dashboard → action.
Is your client feedback right now scattered across emails, notes, or nowhere at all? This toolkit brings it all into one place — whether you're a consultant, cleaner, coach, trainer, or any other service-based professional.
What you get
One Excel file, eight ready-to-use tabs:
1. Read Me — A clear guide to every tab, so you can get started right away.
2. Settings — Enter your business name, tagline, and contact email, set how many surveys you send per period (for response-rate tracking), and edit the Service Type, Team Member, and Status lists to match your business. Supports up to 30 service types, 40 team members, and 8 statuses — every dropdown in the workbook updates automatically.
3. Feedback Survey — A clean, printable one-page survey for your clients: export as PDF, print, email, or send the file directly. Three short rating questions (satisfaction, likelihood to recommend, ease of doing business) plus three open-ended questions — deliberately brief to keep completion rates high.
4. Responses — Your feedback log. Copy answers from returned surveys here, or type them in directly — built for 1,000 responses, enough for years of use. Service Type, Team Member, and Follow-up Status are dropdowns pulled from Settings; NPS category, satisfaction flag, and follow-up flag are calculated automatically for every row.
5. Dashboard — A live, auto-updating view of your CSAT %, NPS score, average customer effort, response rate, trend over time, performance by service type, NPS mix, a benchmark comparison, and an alert for outstanding follow-ups. Everything recalculates automatically as you add rows to Responses.
6. Action Tracker — Rows with a CSAT ≤ 2 or NPS ≤ 6 are pulled in automatically from Responses the moment they're entered — no copy-pasting required. Assign an owner, log the action taken, and track status through to "Resolved" using the built-in dropdown.
7. Benchmarks — Reference points from published customer-experience research, so you know instantly whether your scores are strong, average, or need attention. Sources include the American Customer Satisfaction Index, the Retently NPS Benchmark Report, and Bain & Company's NPS research.
8. ChartData — Supporting data behind the Dashboard's charts.
Why CSAT, NPS, and CES?
CSAT captures how a specific interaction or job made the client feel.
NPS captures long-term loyalty and referral likelihood — the strongest driver of organic growth.
CES captures friction: how easy or hard it was to work with you — research links this closely to repeat business.
Together, these three metrics give you a quantitative trend plus qualitative context.
Why bother asking for feedback systematically?
Research suggests that for every complaint a business receives, roughly 26 customers are unhappy but say nothing — systematically asking for feedback surfaces problems you'd otherwise never hear about. And companies that lead their industry on NPS tend to grow revenue roughly twice as fast as their competitors.
Works right out of the box
Every formula, automation, and chart is already built — just open the file, enter your details on the Settings tab, and start collecting feedback immediately. No plug-ins, no monthly fees, no separate software.

12‑Month Cash Flow Forecasting System for Small Businesses
Torque CashFlow Machine is a complete, automated cash‑flow forecasting engine designed for entrepreneurs who need clarity, control, and confidence over their financial future. It combines real monthly data, smart growth modeling, VAT tracking, scenario analysis, and visual dashboards into one streamlined tool.
What LeverTorque - CashFlow Machine Does
Automatic Monthly Cash Flow Calculation
Enter your monthly income and expenses in blue input cells — the tool instantly calculates:
Gross Cash Flow
Net Cash Flow
Ending Cash Position
VAT impact
Month‑over‑month growth rates
All calculations update live as you enter data.
Real Data → Smart Forecasting
Torque CashFlow Machine uses your actual monthly results to build a rolling 12‑month forecast:
Forecast begins after your Last Actual Month
Growth % is smoothed using up to 3 months of real data
Growth is capped to prevent unrealistic spikes
Forecast extends all the way to December automatically
This gives you a stable, realistic projection of future cash flow.
3‑Month & 6‑Month Quick Forecasts
The Dashboard shows:
Next 3 months (Mo1, Mo2, Mo3)
6‑month trend
Forecasted cash position in 12 months
Perfect for short‑term planning and long‑term visibility.
VAT Tracking & Quarterly Filing
VAT is calculated automatically:
VAT on sales
VAT on purchases
Net VAT payable
Quarterly VAT filing (Mar, Jun, Sep, Dec)
Cumulative VAT balance
You always know what you owe — and when.
Scenario Analysis (Pessimistic / Base / Optimistic)
Test different business conditions instantly:
Sales multiplier
Expense multiplier
Annual income
Annual expenses
Annual net result
Cash position at year‑end
Annual VAT payable
See how your business performs under different assumptions.
Break‑Even Analysis
The Scenarios tab also calculates:
Monthly fixed expenses
Monthly variable expenses
Required monthly sales
Current monthly sales
Safety margin (in dollars and %)
You know exactly how far you are from break‑even — or how far above it.
Visual Charts & Trend Lines
Automatic charts show:
Total income
Total expenses
Net cash flow
Ending cash position
VAT payable over time
Clear visuals make financial decisions easier.
Alerts & Warnings
The Dashboard highlights critical signals:
Low cash flow
Negative monthly result
Upcoming VAT filing
You see problems before they happen.
Key Features at a Glance
Automated cash flow engine
12‑month forecast
VAT tracking & quarterly filing
Growth‑based forecasting model
Scenario analysis (3 modes)
Break‑even calculation
Safety margin indicators
Visual charts & dashboards
Minimum cash target monitoring
Fully editable blue input fields
No macros — works on Excel 2016+ and Microsoft 365

12‑Month Cash Flow Forecasting System for Small Businesses
Torque CashFlow Machine is a complete, automated cash‑flow forecasting engine designed for entrepreneurs who need clarity, control, and confidence over their financial future. It combines real monthly data, smart growth modeling, VAT tracking, scenario analysis, and visual dashboards into one streamlined tool.
What LeverTorque - CashFlow Machine Does
Automatic Monthly Cash Flow Calculation
Enter your monthly income and expenses in blue input cells — the tool instantly calculates:
Gross Cash Flow
Net Cash Flow
Ending Cash Position
VAT impact
Month‑over‑month growth rates
All calculations update live as you enter data.
Real Data → Smart Forecasting
Torque CashFlow Machine uses your actual monthly results to build a rolling 12‑month forecast:
Forecast begins after your Last Actual Month
Growth % is smoothed using up to 3 months of real data
Growth is capped to prevent unrealistic spikes
Forecast extends all the way to December automatically
This gives you a stable, realistic projection of future cash flow.
3‑Month & 6‑Month Quick Forecasts
The Dashboard shows:
Next 3 months (Mo1, Mo2, Mo3)
6‑month trend
Forecasted cash position in 12 months
Perfect for short‑term planning and long‑term visibility.
VAT Tracking & Quarterly Filing
VAT is calculated automatically:
VAT on sales
VAT on purchases
Net VAT payable
Quarterly VAT filing (Mar, Jun, Sep, Dec)
Cumulative VAT balance
You always know what you owe — and when.
Scenario Analysis (Pessimistic / Base / Optimistic)
Test different business conditions instantly:
Sales multiplier
Expense multiplier
Annual income
Annual expenses
Annual net result
Cash position at year‑end
Annual VAT payable
See how your business performs under different assumptions.
Break‑Even Analysis
The Scenarios tab also calculates:
Monthly fixed expenses
Monthly variable expenses
Required monthly sales
Current monthly sales
Safety margin (in dollars and %)
You know exactly how far you are from break‑even — or how far above it.
Visual Charts & Trend Lines
Automatic charts show:
Total income
Total expenses
Net cash flow
Ending cash position
VAT payable over time
Clear visuals make financial decisions easier.
Alerts & Warnings
The Dashboard highlights critical signals:
Low cash flow
Negative monthly result
Upcoming VAT filing
You see problems before they happen.
Key Features at a Glance
Automated cash flow engine
12‑month forecast
VAT tracking & quarterly filing
Growth‑based forecasting model
Scenario analysis (3 modes)
Break‑even calculation
Safety margin indicators
Visual charts & dashboards
Minimum cash target monitoring
Fully editable blue input fields
No macros — works on Excel 2016+ and Microsoft 365